In modern drilling, staying in the reservoir is everything. Every extra meter drilled inside the productive zone means more hydrocarbons recovered and higher project profitability. Yet operators often face blind spots in real-time formation evaluation, particularly when relying on a single data source.
This case study highlights how integrating cuttings analysis with logging-while-drilling (LWD) data provides sharper, faster geosteering decisions.
Traditional geosteering workflows depend heavily on LWD data. While invaluable, LWD readings are not always enough to capture subtle lithological variations or identify formation boundaries in real time. Meanwhile, drill cuttings (samples already available on every rig) often go underutilized, treated as a byproduct instead of a decision-making tool.
The result?
Operators may react late to geological changes, slipping into non-productive zones or drilling extra footage that adds cost without delivering value.
By combining cuttings analysis with LWD density and gamma-ray logs, operators gain a multi-dimensional view of the formation while drilling. Cuttings provide direct lithological evidence, while LWD delivers continuous real-time measurements.
Together, these datasets complement each other:
In the Abu Dhabi field trial, engineers implemented this integrated workflow while drilling a complex carbonate well. The results were clear:
For drilling teams and asset managers, this approach translates directly into business value:
It’s a practical innovation: no new downhole tools are required. Instead, it makes smarter use of the data already available on every rig.
The Abu Dhabi case study shows that integrating cuttings and LWD data is a pathway to smarter, more profitable drilling. By combining direct geological samples with real-time logging, operators can eliminate blind spots, react faster, and maximize the value of every well drilled.
Adaga Solutions is helping operators put this integrated workflow into practice today. Want to see how it could work on your next project? Contact us to learn more.
When it comes to horizontal drilling, every foot counts. The closer you keep the wellbore inside the productive reservoir, the more profitable the project becomes. But making those decisions in real time isn’t easy—especially when your sensors are sitting a few meters behind the drill bit. That delay often causes costly detours into non-productive rock.
For operators under pressure to improve drilling efficiency, avoid wasted footage, and maximize reservoir contact, the difference between success and setback often comes down to how quickly lithology changes can be detected.
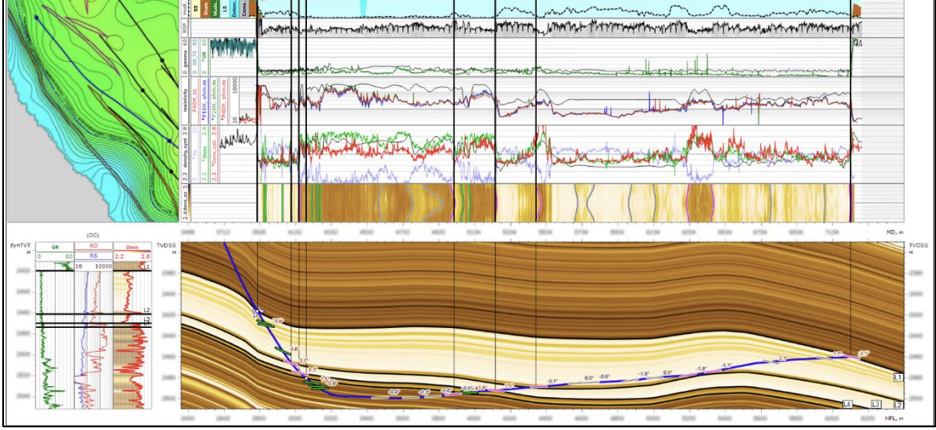
In carbonate reservoirs and other complex formations, density logging plays a critical role in identifying rock properties and boundaries. But there’s a catch. Conventional logging-while-drilling (LWD) density tools sit well above the drill bit. This creates a “blind spot” between where the bit is cutting and where the sensor is measuring.
By the time the tool registers a density change, the drill may already have passed through valuable sections—or wasted hours cutting into non-productive layers. The result? More non-productive time, increased costs, and less hydrocarbon recovery.
Adaga Solutions has developed a smarter way to bridge this gap. By combining standard engineering drilling parameters—such as weight on bit, hook load, rotation speed, and rate of penetration—with LWD density information, operators can calculate rock density directly at the bit.
Think of it as swapping a rear-view mirror for a set of headlights. Instead of waiting for delayed measurements from behind the drill, the software delivers predictive, real-time insights right where decisions are made. This makes it possible to anticipate lithology shifts, adjust trajectories faster, and steer the wellbore with precision.
This approach doesn’t require additional tools downhole. Instead, it unlocks new value from the drilling data operators are already collecting.
Real-time density at the bit isn’t just an academic breakthrough—it delivers tangible results for drilling teams and project economics.
For operators navigating thin or variable pay zones, these benefits directly translate into better performance and improved project profitability.
The approach isn’t just theory—it’s already delivering results in the field. In one carbonate reservoir project, engineers applied Adaga’s calculated density at the bit workflow while drilling Well #8.
With the ability to “see” rock density in real time, the team avoided unnecessary footage through non-productive rock, made faster steering decisions, and kept the drill in the reservoir’s most productive interval for longer.
The case validated what engineers suspected: density prediction at the bit provides a strong correlation with LWD logs, while reducing reliance on delayed sensor data.
The future of geosteering isn’t about adding complexity—it’s about making the most of the drilling data already at your fingertips. Calculating density at the bit closes the gap between action and insight, enabling operators to:
At Adaga Solutions, we’re proving that smarter geosteering software doesn’t just improve well placement—it improves bottom-line results.
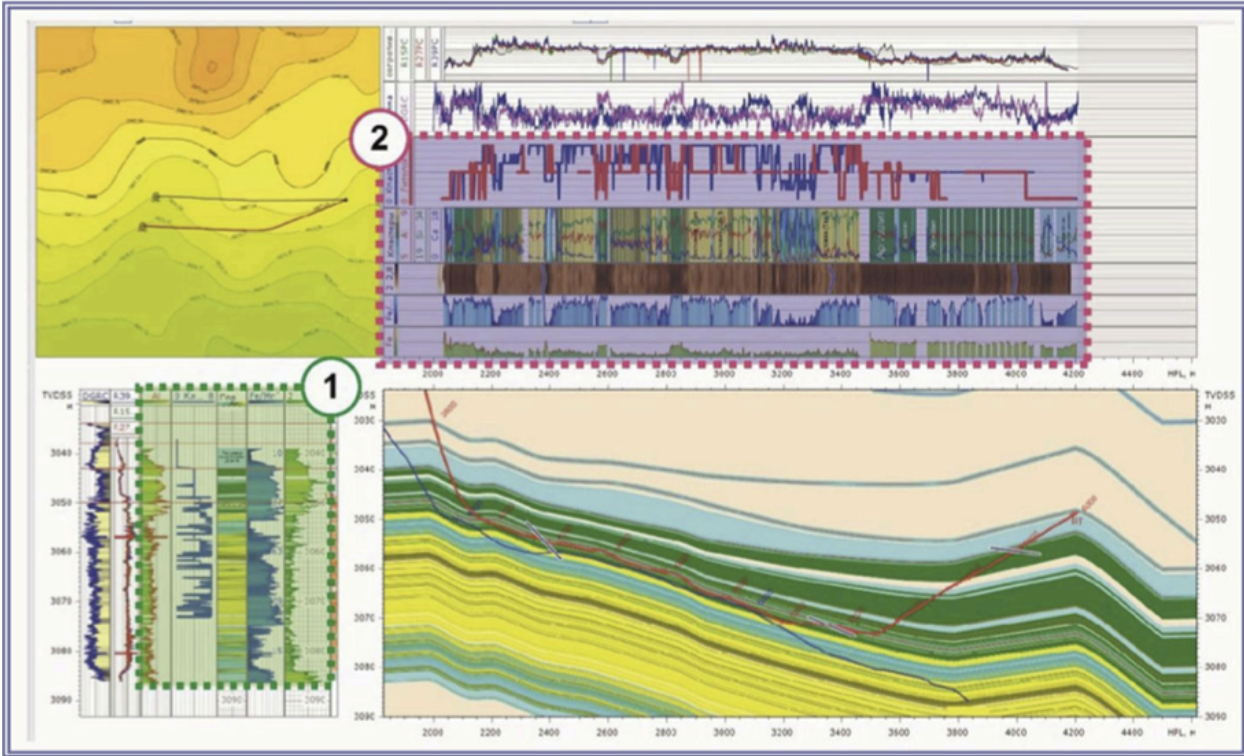
Digital transformation has been altering the way we process and consume information coming from the rig sensors. Gigabytes of real-time log data are being transferred and stored on WITSML servers and are readily available for the end-users. With increased computer and programming capabilities, these data can be utilized for both geosteering and drilling analytics purposes. When it comes to the integration of these areas in one suite, it unveils significant room for advancements in operations. Specifically, our team managed to bring real-time changes of well tops, retrieved from the geosteering model, into an integrated correlation panel continuously adjusting the technological parameters’ forecast for current horizontal well being drilled. A proactive approach helped our client to avoid unplanned operations and complications. In this paper, we are showing the study cases of this integration gained during the combined service for 20 wells in the East Siberian region.
Remote geosteering support centres, with a multi-monitor setup, appear either at operator or service company offices. And practice shows that one geosteering specialist can normally handle up to five horizontal wells at a time. This advancement in operations has been decreasing operational cost that convinces more and more companies to transfer their personnel from the rig to the office to perform remote well placement. On the other side, the same emerging trend can be captured for directional drilling services. The market started to suggest a remote directional drilling steering service that allows another circle of cost-cutting. However, because of the traditional academic separation of drillers and geologists, the processes they operate and manage are not fully integrated into each other. As a result, the drilling programs are based on the pre-job geological models and are not being adjusted to geosteering model changes in real-time. Therefore, technological parameters are being applied to the wrong geological conditions with corresponding consequences.
After discussions on client’s needs, our team introduced in 2019 a solution that enables visualization and processing of technological and geological parameters within the same integrated well correlation panel. Once the geosteering model has been changed, new well tops are being transferred via the cloud to the correlation panel to adjust the technological parameters’ forecast for the current horizontal well being drilled.
An integrated well correlation panel allows a user to correctly respond to changes, minimizing the risk of unplanned operations and complications. Plotting the graphs of actual technological parameters in real-time against the calculated ones allows a user to quickly evaluate the condition of the wellbore and the possibility of continuing drilling to the designed total depth. Torque and drag diagram is being compared against planned one with an adjusted prognosis on well top depth.
During Geoconvention 2020, we demonstrated results of one this integration gained over the years combining the service, geosteering, and drilling analytics, for 20 wells in the East Siberian region. Gained experience is equally applicable for high-tier and low-tier projects. Along with geosteering/drilling analytics integration and within the same project, we introduced also automatic drilling operation and KPIs recognition.
Results
Implementing integration of real-time geosteering and drilling analytics helps to address changing geological conditions and results in decreasing NPT. The correlation between both parameters and this technique can be used in a wide variety of operations such as while drilling Viking Formation in Saskatchewan, where Gamma Ray data differences are not clear enough to sustain a geosteer based on that data.